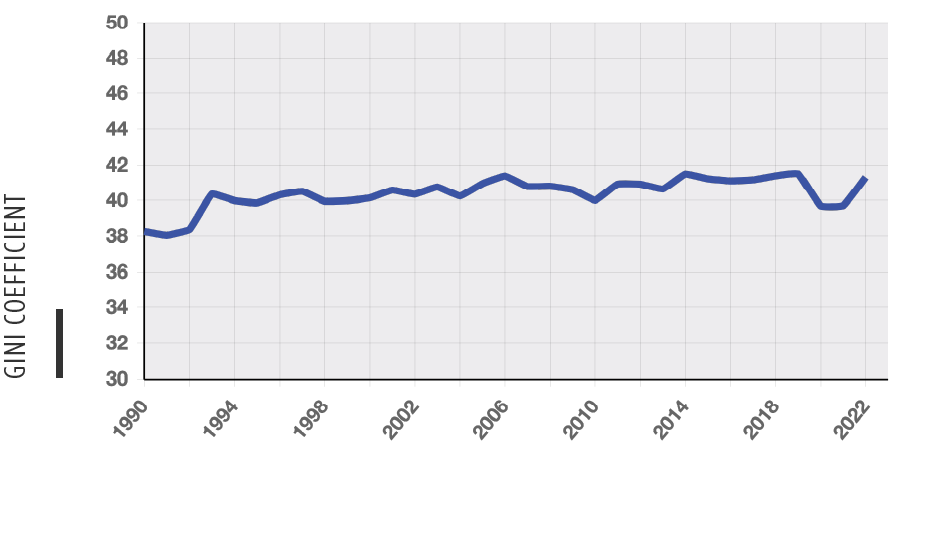
Income inequality
Income “Gini” coefficient (net of government taxes and transfer programs). This is an index that ranges from 0-100 where higher numbers indicate more inequality.
Why did we include this measure?
The Gini coefficient is a common measure of inequality and describes the extent to which a measure like income is concentrated within certain groups. When the income Gini coefficient is 0, it means everyone has exactly the same income. When it is 100, it means that a single person has all the income. (Of course, these extremes almost never occur in practice but the extremes are useful for understanding the scale.) The specific income Gini coefficient we use captures all sources of income, including but going beyond the wage earnings discussed above. We also prefer this measure because it reflects the income of all households, rather than just comparing the rich and poor (i.e., those at the ends of the income distribution).
How does the US rank globally?
- Specific Measure: Income “Gini” coefficient
- Percentage of countries the US outperforms: 22% (out of 27 countries)
- International Rank Trend: Worsening
National Trend Worsening

What do the data show?
Income inequality has been rising slightly since 1990, but with a temporary dip during the COVID pandemic. The US compares poorly relative to the rest of the world. We rank in the bottom 25% of countries, just below El Salvador, the Dominican Republic, and Lithuania–and we are falling further behind over time.
The spike in the figure in 1993 should be interpreted with caution; it is likely the result of a change in the way the data were collected, rather than a true change in income inequality. (See Data Notes for more detail.)
What might explain these patterns?
Income inequality is driven by a complex set of forces, including the variation in education and human capital, decisions made by individuals regarding their careers and work hours, segregation and isolation of opportunity, the strength of labor unions and minimum wage laws, free trade policies that place US workers in competition with those in low-wage countries, technological change favoring high-skill workers, and government taxation and spending. Given these general causes, our low international standing is not especially surprising. The US has more unequal education outcomes than other countries, weaker unions, lower minimum wages, and lower government spending on the social safety net than other countries.
While do not argue that any of these factors is more important than the others, we can say that the rise in income inequality is driven mainly by people with very high incomes. As we show below, poverty is actually declining, which reduces income inequality. So, the “rich are getting richer” faster than the poor.
Also, income inequality is intertwined with wealth inequality. Wealth comes mostly from inheritance and other financial support across generations, which also produces income. The high and growing level of US wealth inequality therefore partially explains rising income inequality.
For more information about data sources and treatments, download the Data Notes.
Vivamus sagittis lacus vel augue laoreet rutrum faucibus dolor auctor.
Sed posuere consectetur est at lobortis. Sed posuere consectetur est at lobortis. Praesent commodo cursus magna, vel scelerisque nisl consectetur et. Aenean lacinia bibendum nulla sed consectetur. Donec sed odio dui. Maecenas sed diam eget risus varius blandit sit amet non magna. Cras justo odio, dapibus ac facilisis in, egestas eget quam. Cum sociis natoque penatibus et magnis dis parturient montes, nascetur ridiculus mus. Praesent commodo cursus magna, vel scelerisque nisl consectetur et. Donec id elit non mi porta gravida at eget metus.